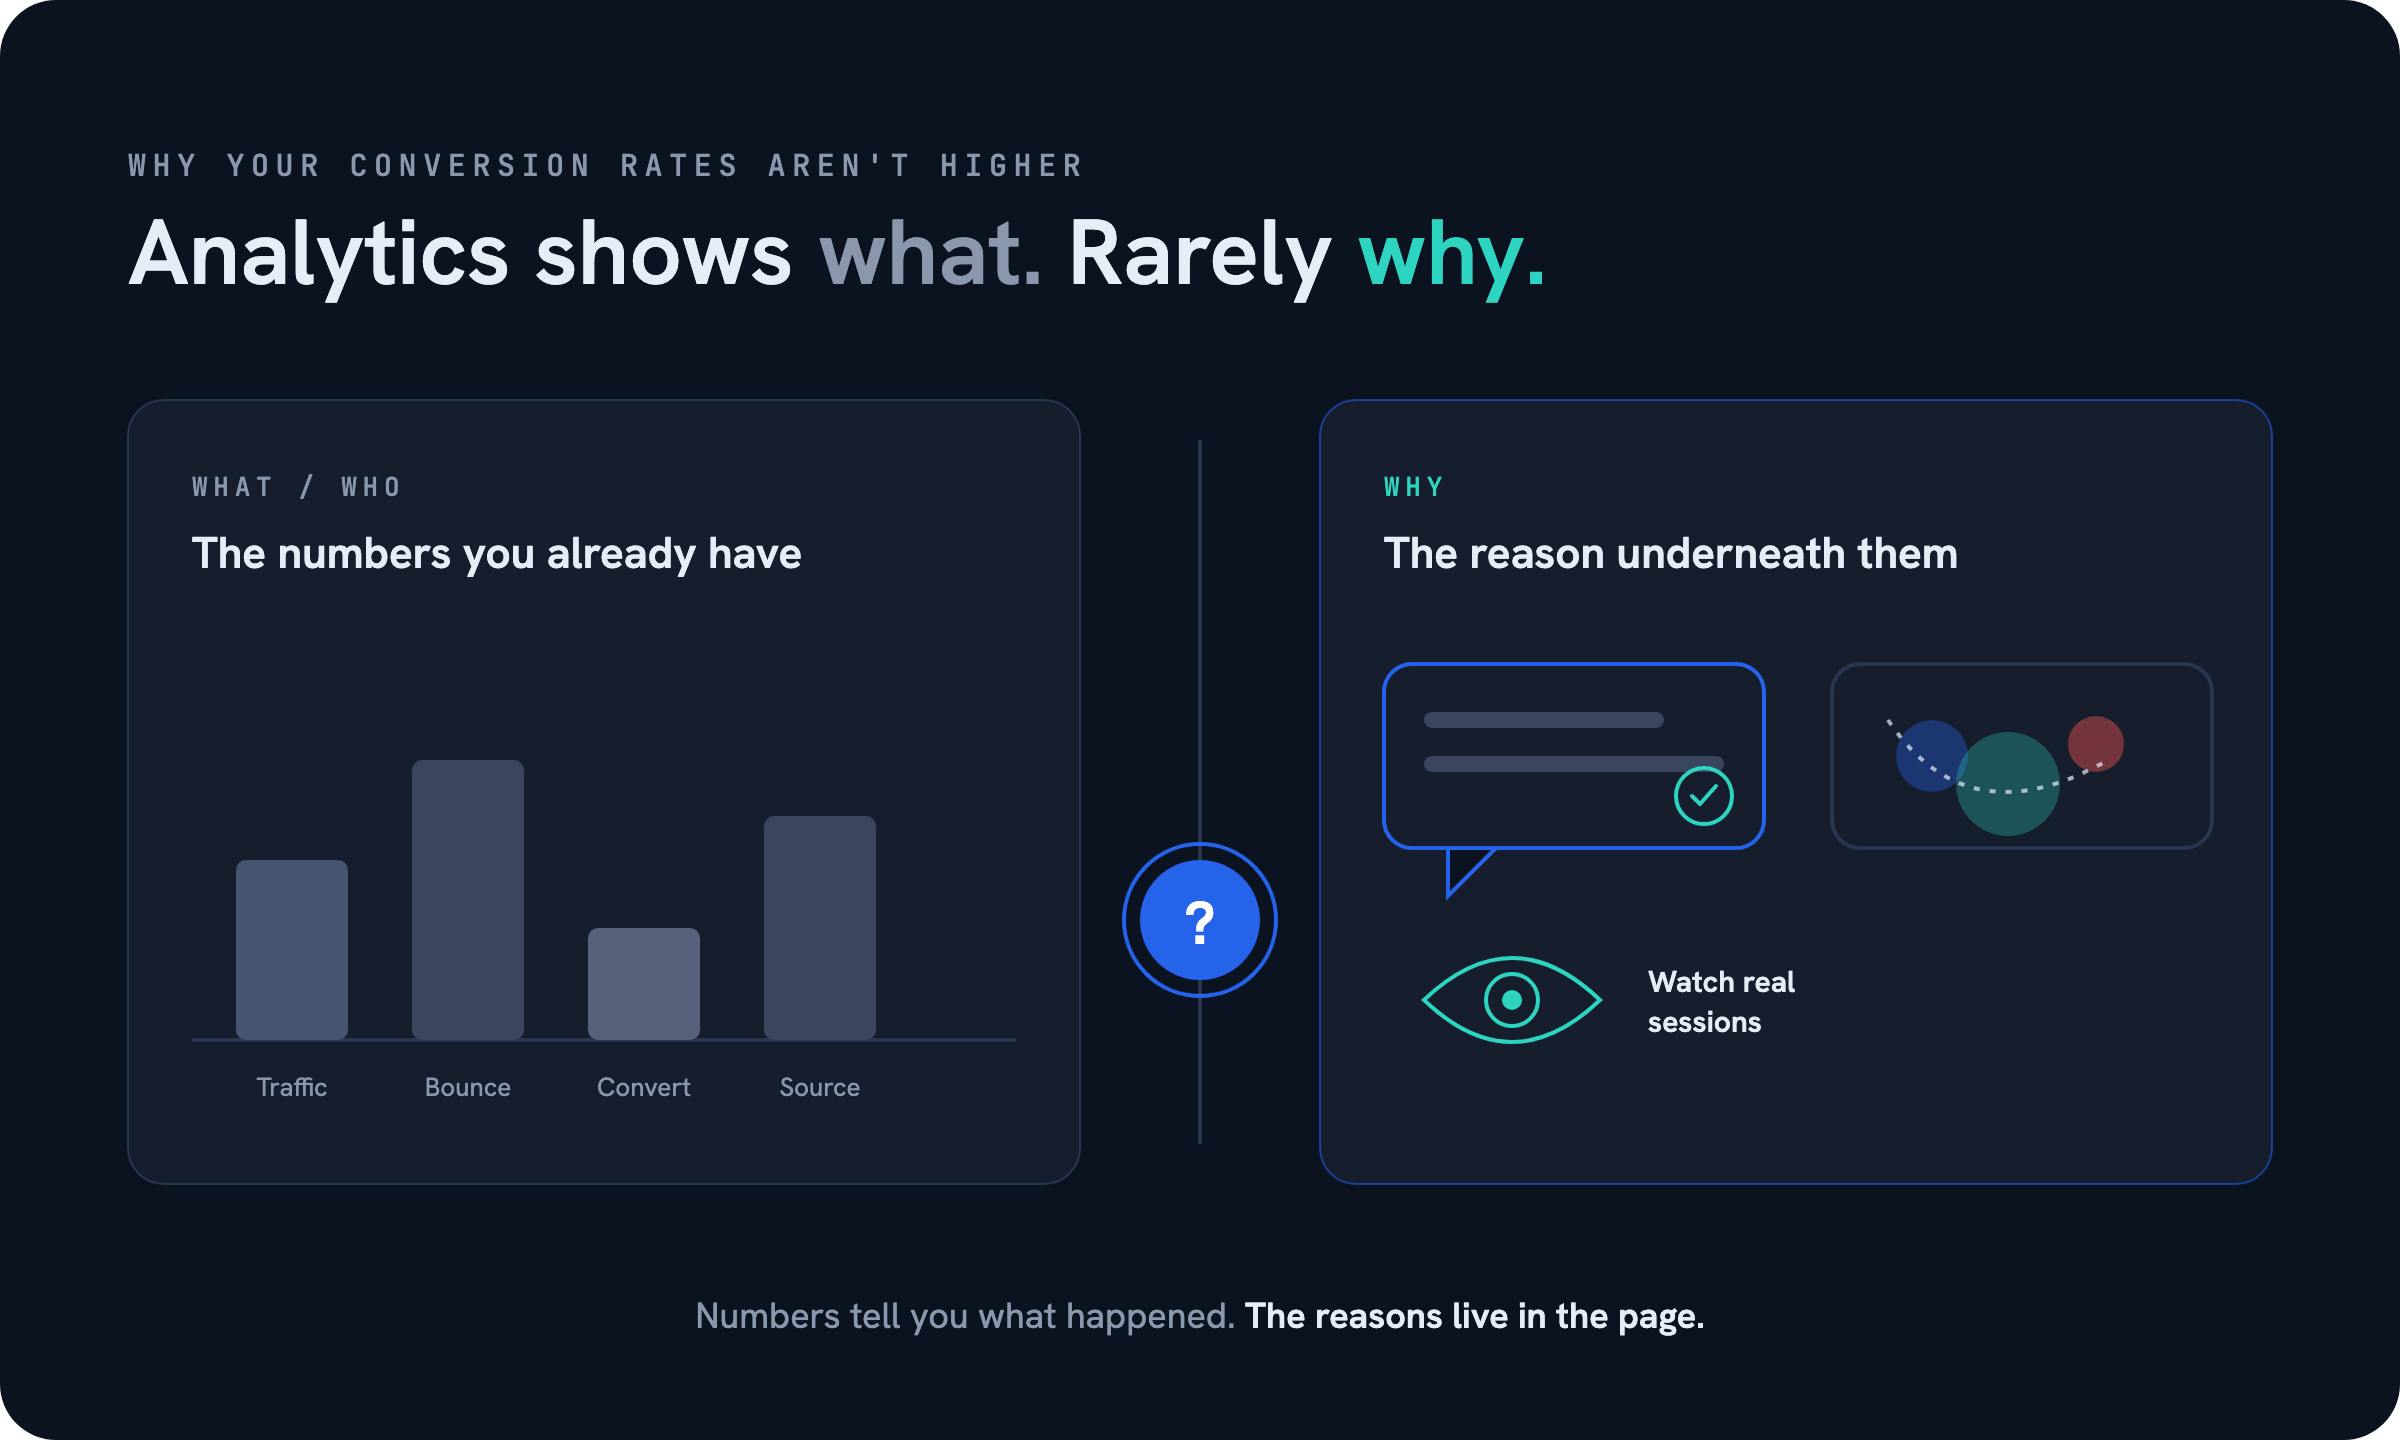
You can see exactly how many people convert on your site and how many don’t. What your analytics can’t tell you is why. Why does one visitor on your top page buy, fill out the form, or sign up — while the next one, who looks the same on paper, leaves? Numbers tell you what happened. They rarely tell you the reason. And without the reason, every change you make is a guess.
What is your data actually missing?
Your quantitative data — traffic, bounce rate, conversion rate — tells you who visits and where they drop off. That’s necessary, but it’s only half the picture. It points to the page that’s leaking; it doesn’t tell you what’s driving people away once they’re on it.
Qualitative data fills that gap. It’s the direct feedback, behavior, and reasoning behind the numbers — the “why” underneath the “what.” When you understand why people hesitate, leave, or abandon a step, you stop guessing at fixes and start forming testable ideas grounded in what real visitors actually experience.
How do you find out why people don’t convert?
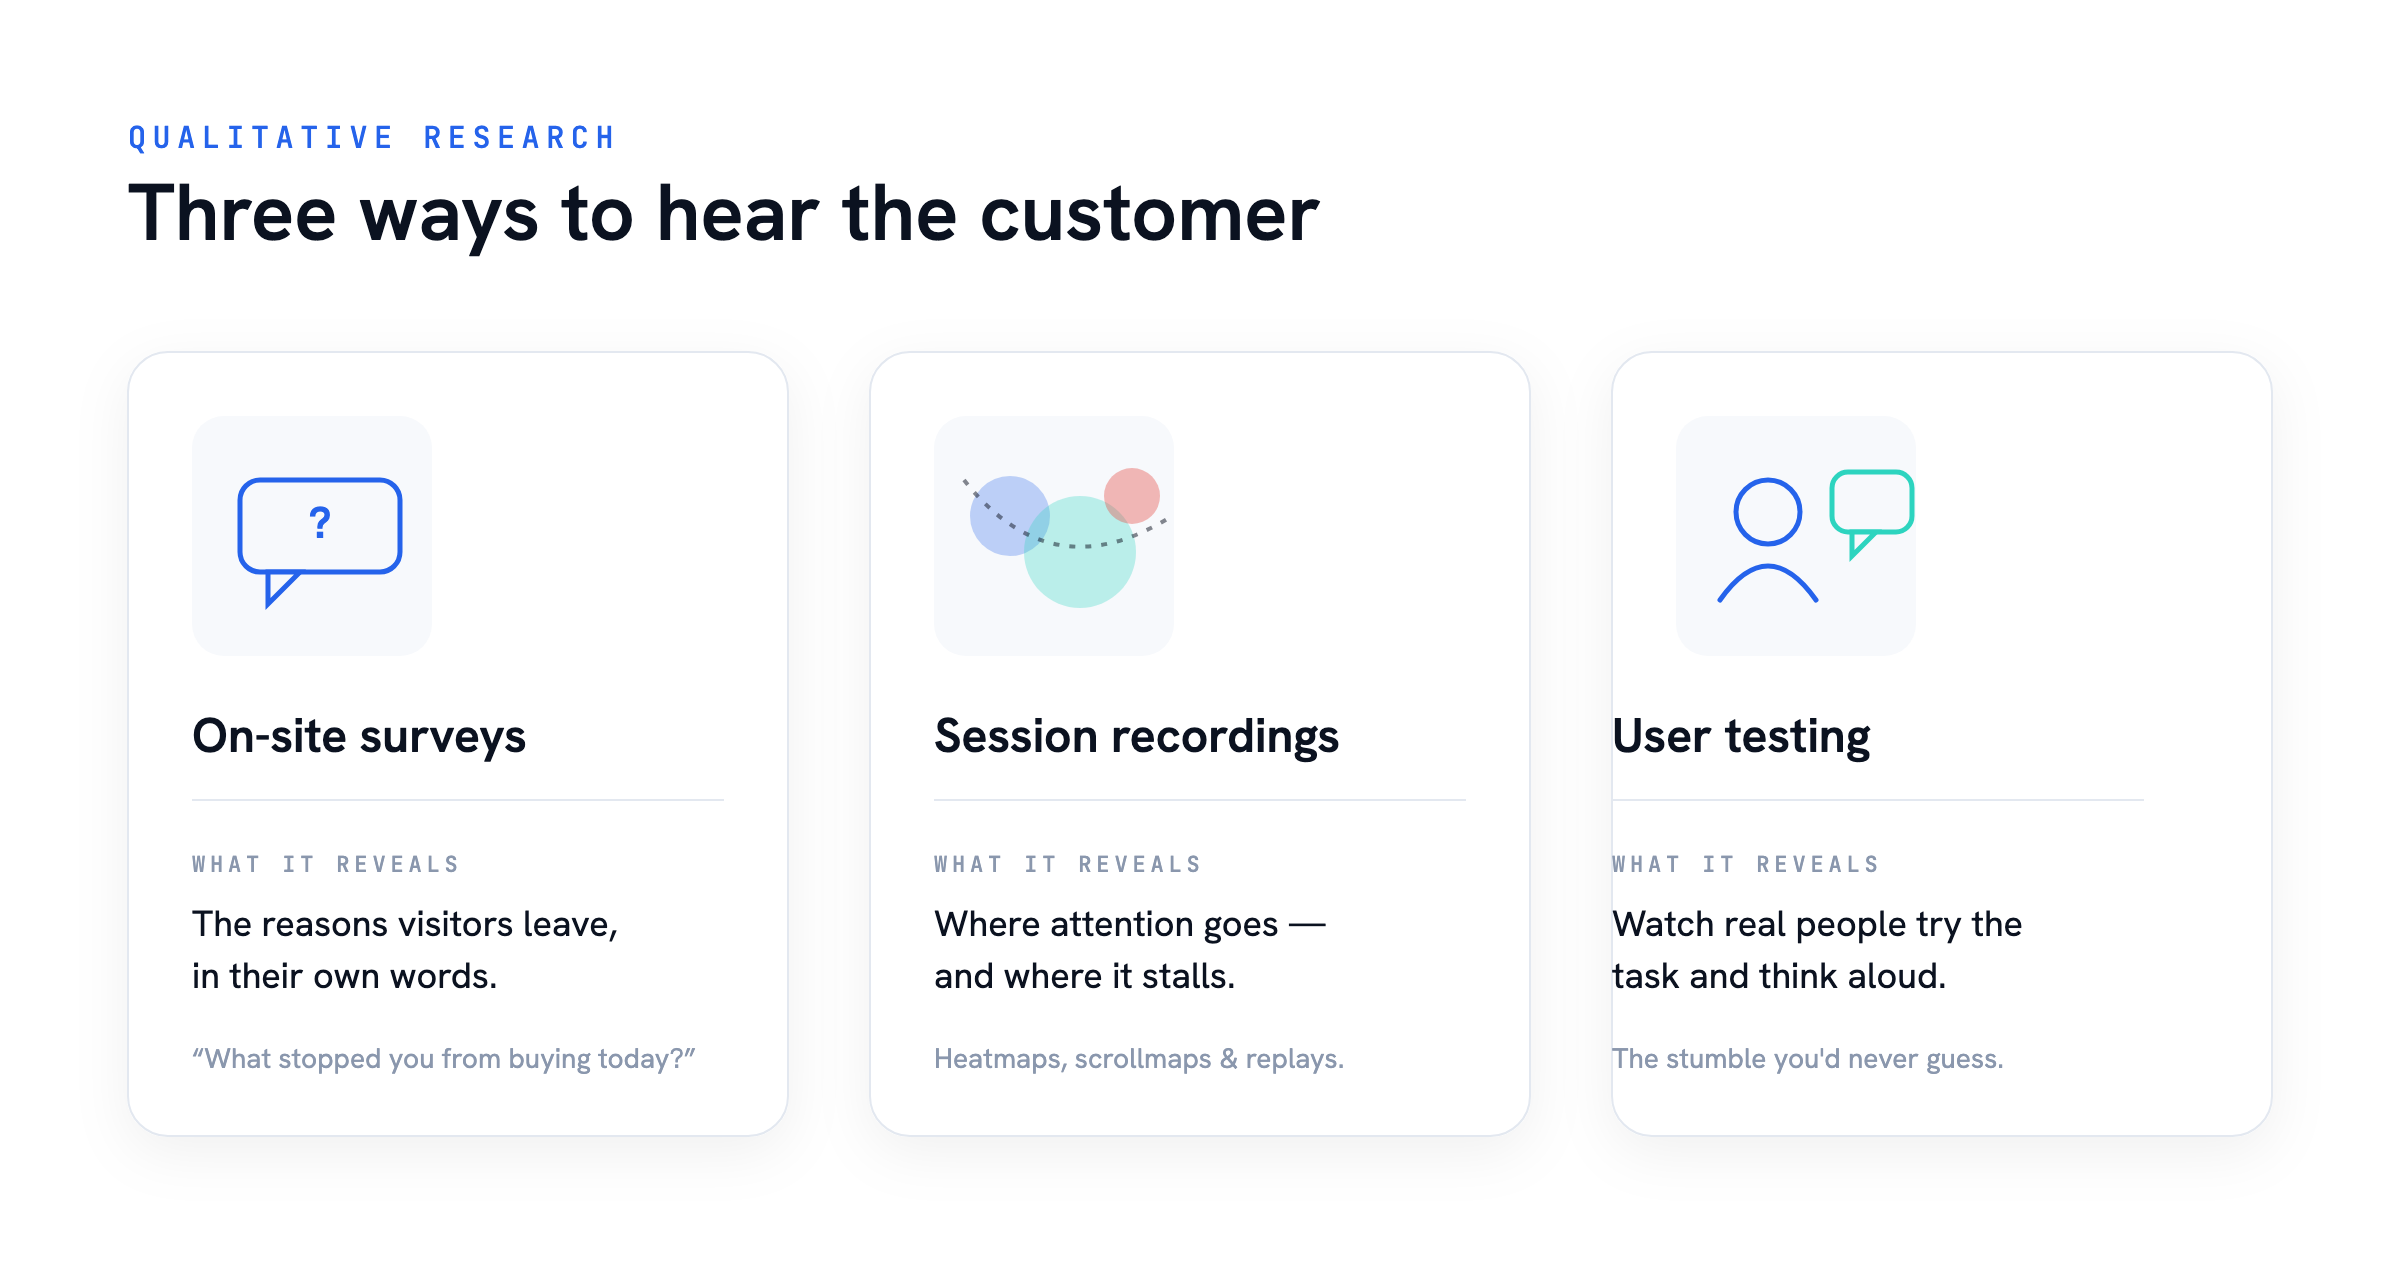
The most reliable way to learn why visitors behave the way they do is to gather their feedback and watch them use your site. A few approaches do most of the work:
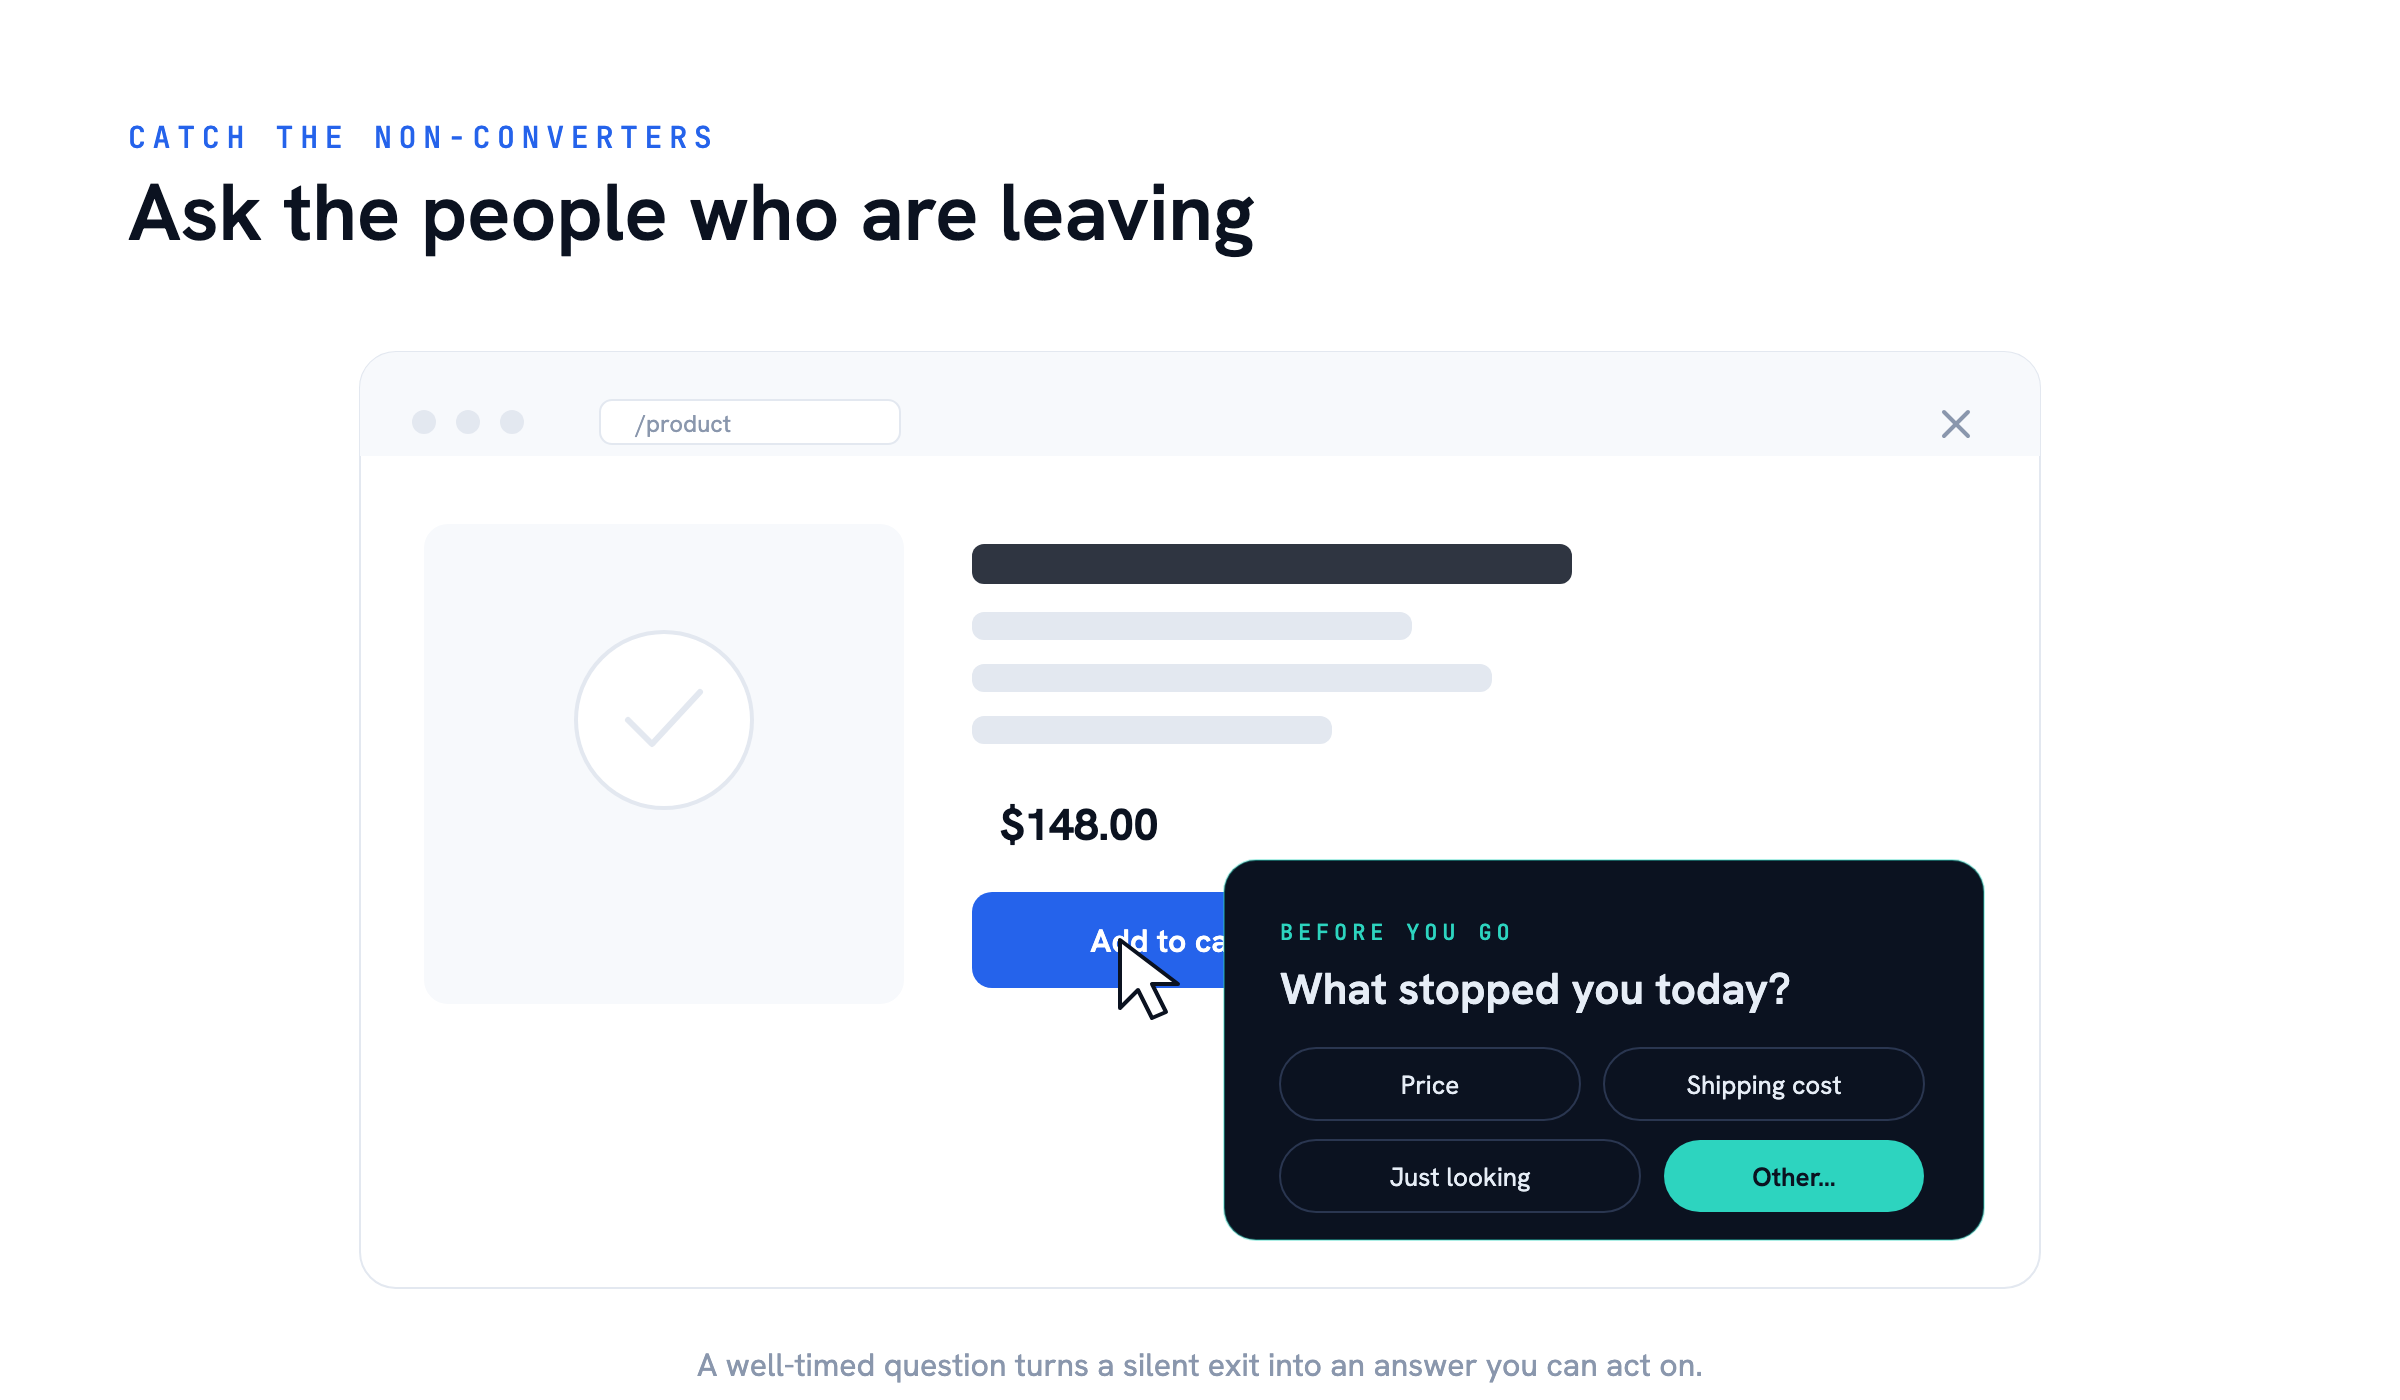
- On-site surveys. Ask a short, well-timed question at the moment that matters. After someone completes an action, ask what convinced them — “What made you finish your purchase today?” Just as useful is asking the people who don’t convert: trigger a quick survey when a visitor moves to leave a key page, and ask “What’s stopping you?” or “What is this page missing?” Tools like SurveyMonkey or Hotjar make this straightforward.
- Session and behavior recordings. Heatmaps and recordings show where people click, how far they scroll, and where they hesitate or get stuck. Patterns you’d never spot in a spreadsheet show up immediately when you watch real sessions.
- User testing. Watch people work through your site — and your competitors’ — narrating as they go. Hearing someone say out loud where they got confused is often worth more than any chart. You start to hear the genuine voice of the customer.
The point isn’t the specific tool. It’s putting yourself in your visitors’ shoes so you understand their intent, not just their clicks.
Why does device type change the answer?
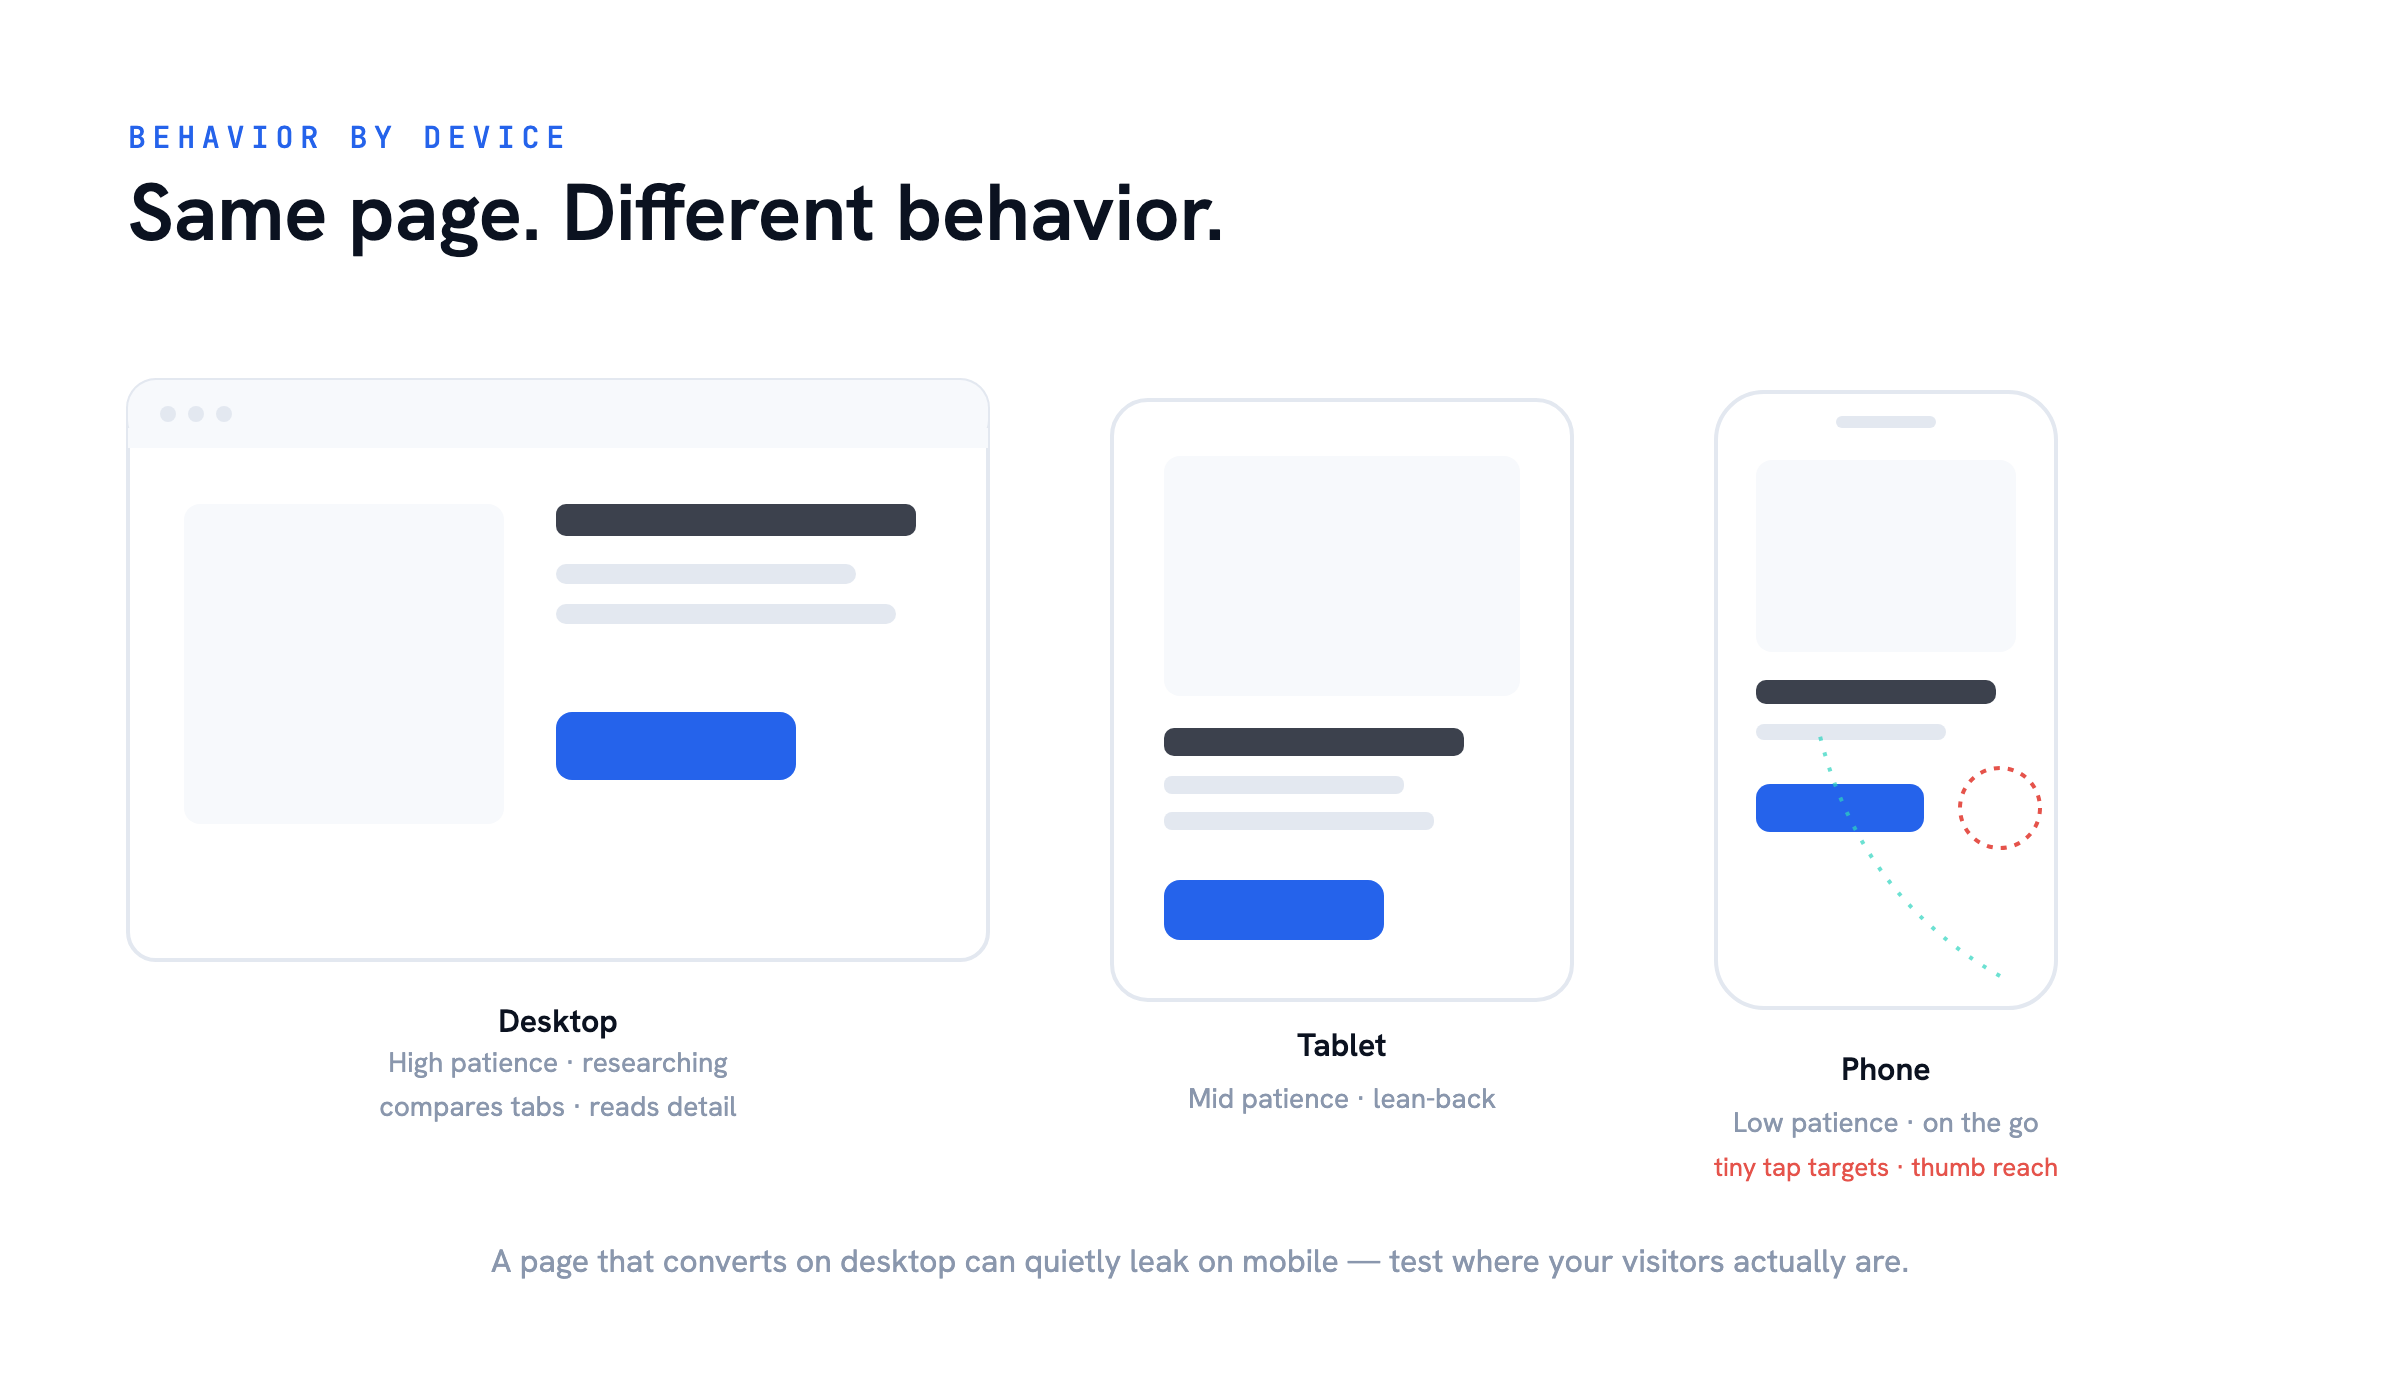
The same page can work on a desktop and quietly fail on a phone. People behave differently depending on whether they’re on mobile, tablet, or desktop — their patience, their context, and the obstacles they hit all shift. If you collect feedback and behavior separately by device, you’ll often find the real reason your conversion rate is stuck is hiding in one device experience, not across all of them.
How do you turn the “why” into a plan?
Once you understand why people convert and why they don’t, you can prioritize. Not every problem is worth the same effort, and a handful of issues usually account for most of the lost conversions — the 80/20 rule applied to your funnel. Rank the opportunities by likely impact, line them up against your goals, and test the highest-value changes first. That’s how you get a meaningful result in a reasonable amount of time, instead of churning through small tweaks and hoping one lands.
Combining the who and where from your analytics with the why from qualitative research is what turns optimization from guesswork into a deliberate, data-driven plan.
If your conversion rate has plateaued and you can’t see why, that “why” is exactly what a structured conversion review is built to uncover. [Book a consultation](/contact/) and we’ll take a look.