Most teams know roughly which pages matter — the ones with the most traffic, or the ones closest to a sale. The harder question is what to actually change on those pages. Knowing where people go tells you nothing about what they do once they get there, or why they leave without converting. Closing that gap is the real first step in improving a website, and it’s almost always a question of pairing two kinds of data.
Where do you start looking?
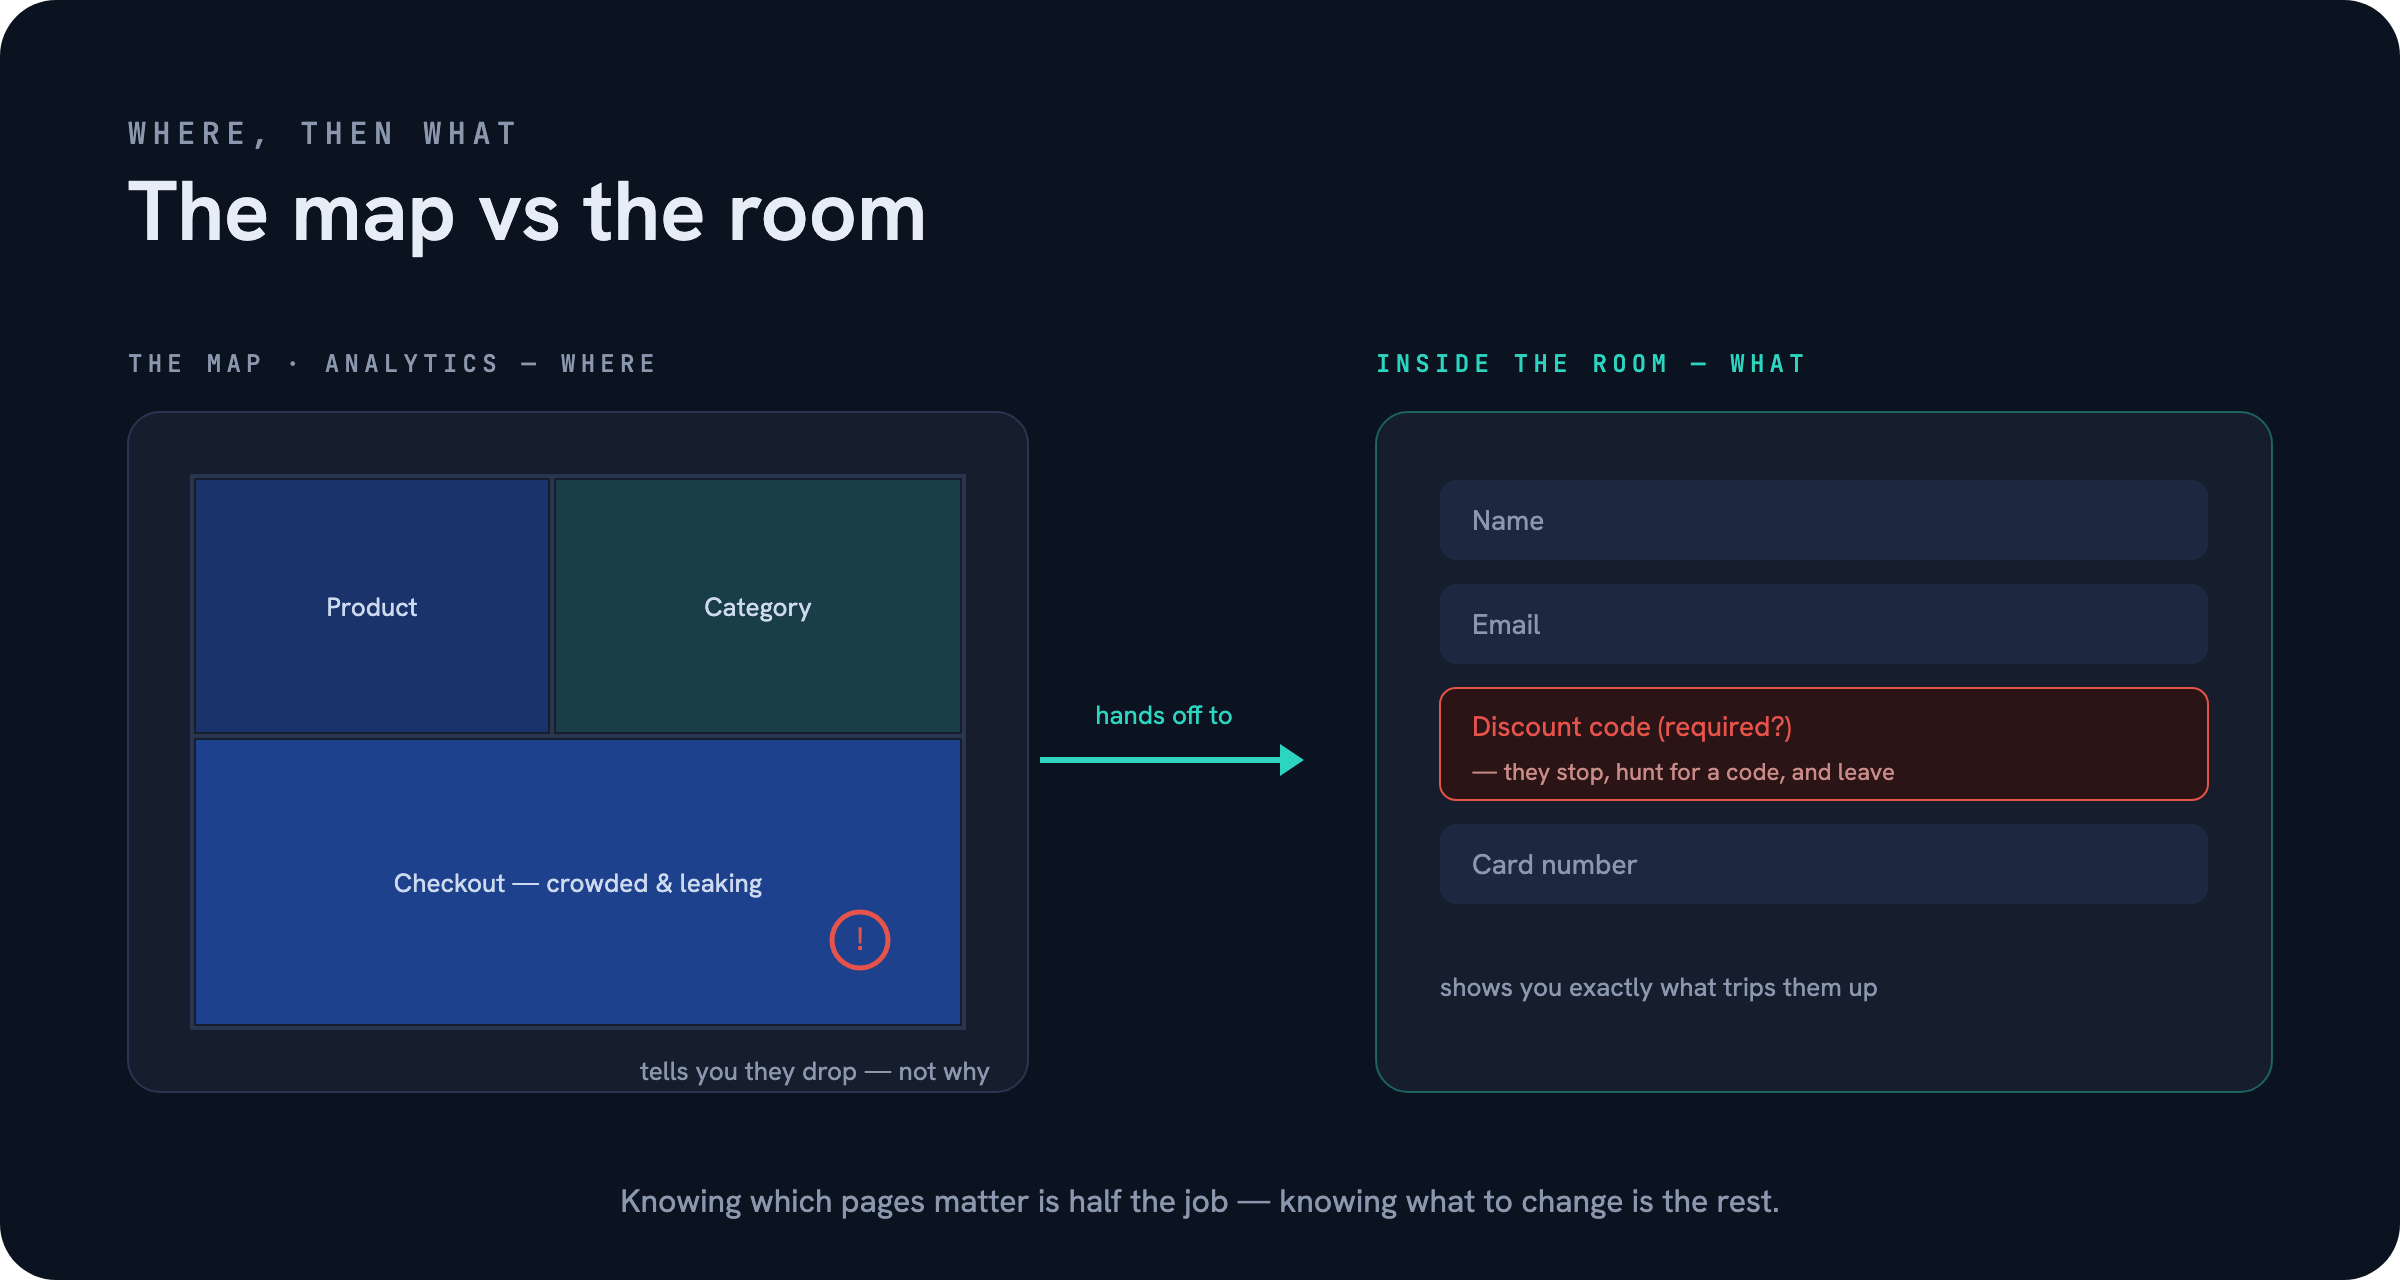
Start with the pages that have the most to gain: your highest-traffic pages and the ones tied most directly to a conversion — a purchase, a signup, a lead form. Your analytics tool (Google Analytics or whatever you already run) is good at telling you this. It’s quantitative data: it answers where people are and how many of them drop off. That’s the map. It tells you which rooms are crowded — but not what people are tripping over once they’re inside.
How do you figure out what people are actually doing?
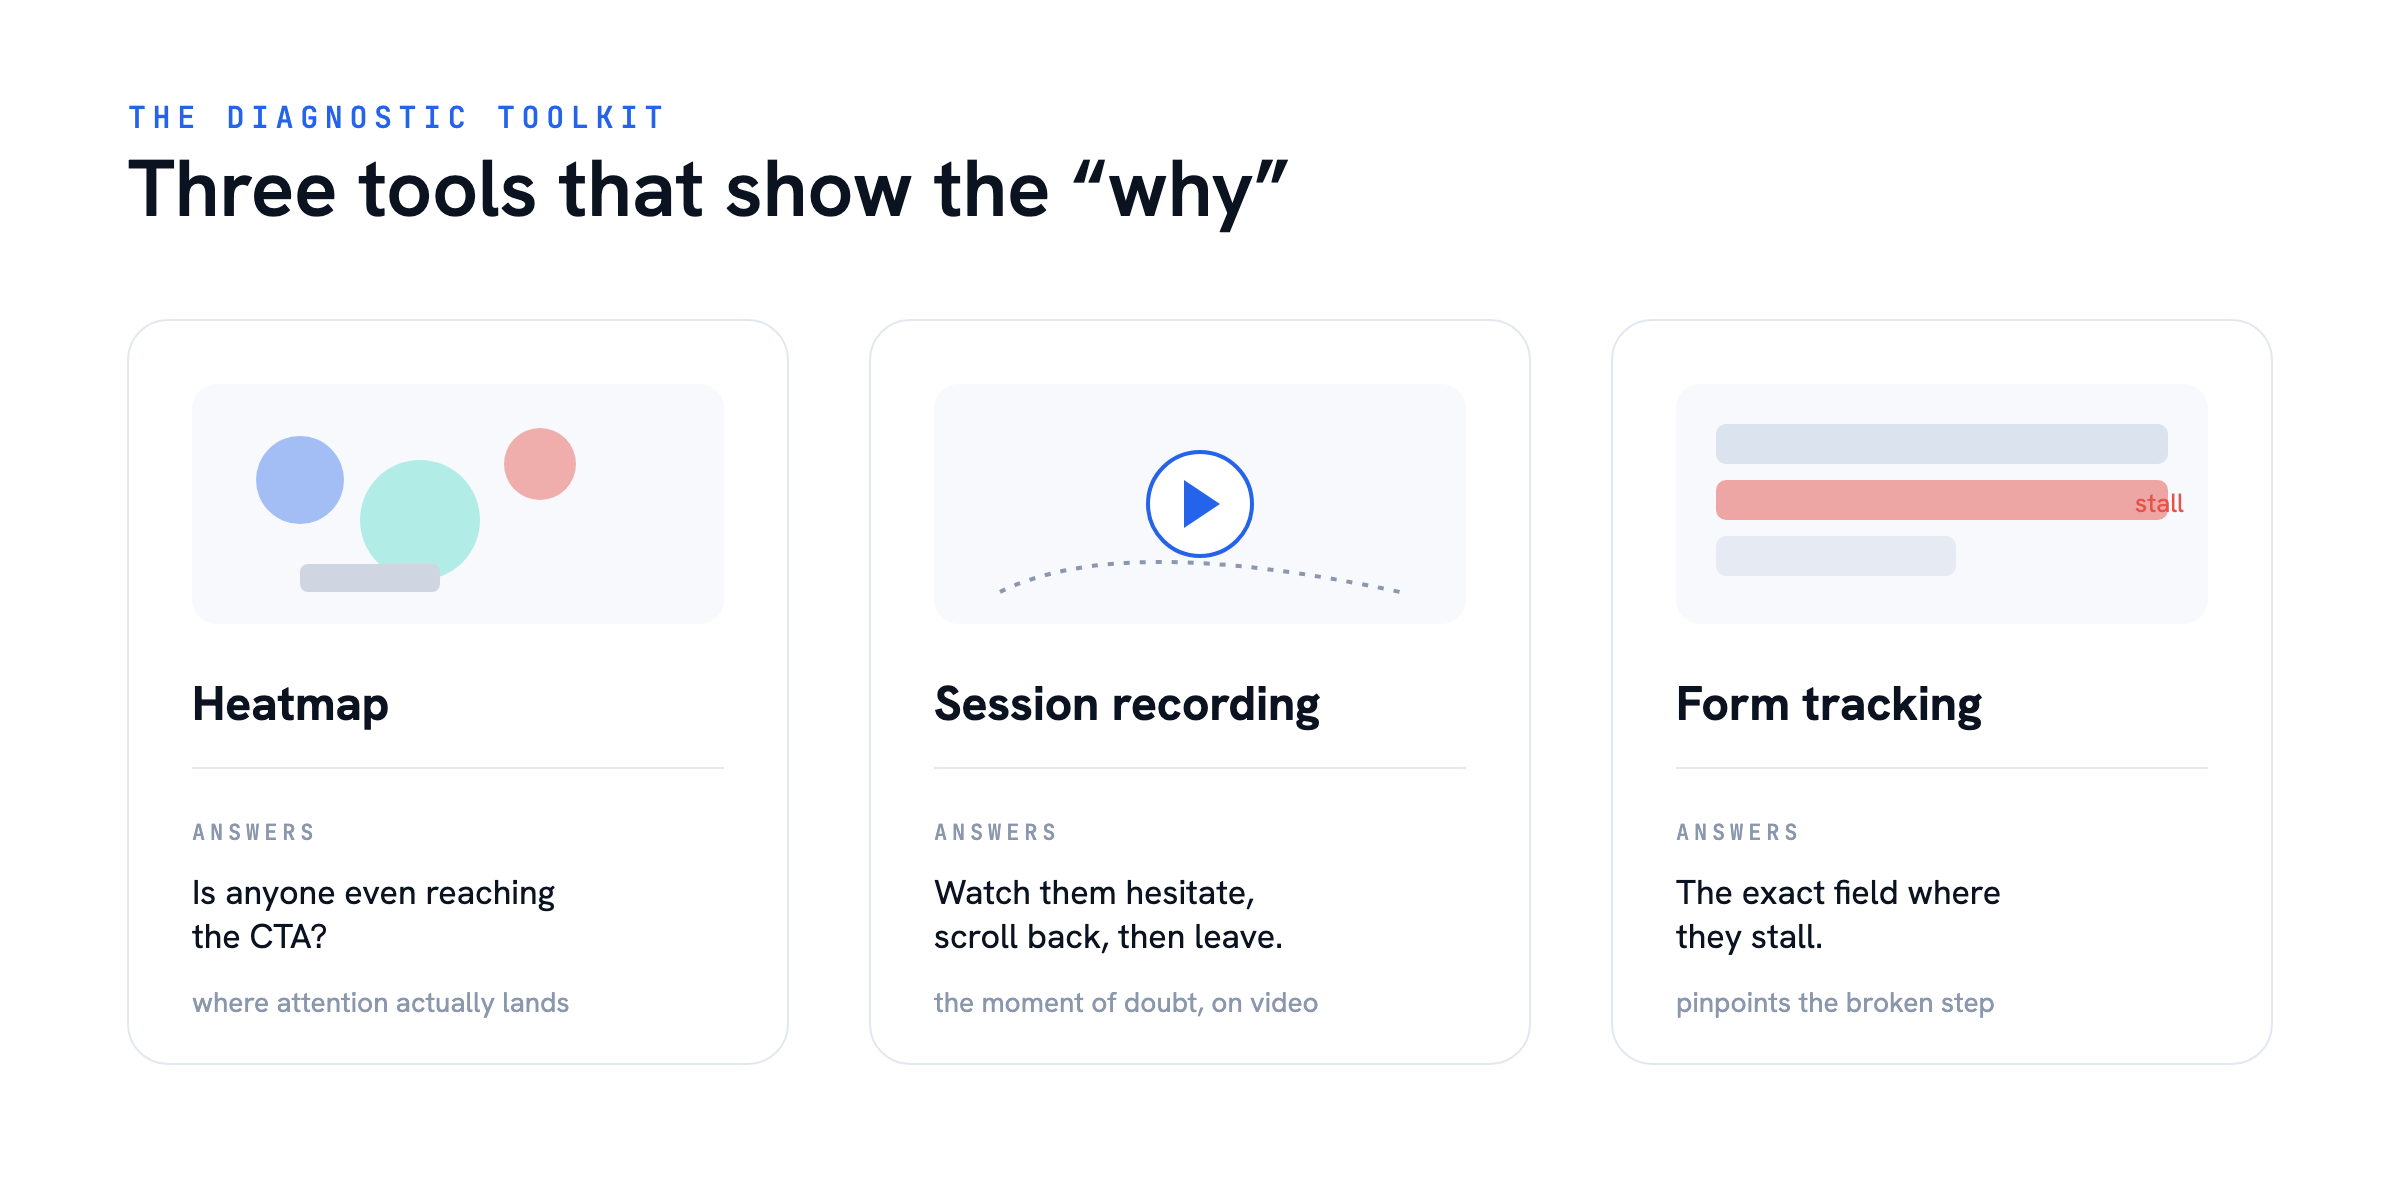
Quantitative data tells you a page is leaking. It won’t tell you why. For that you need qualitative data — a record of real behavior on the page itself. The everyday tools here are heatmaps (where people click and how far they scroll), session recordings (a replay of a real visitor’s path through the page), and form-interaction tracking (which fields people fill, skip, or abandon).
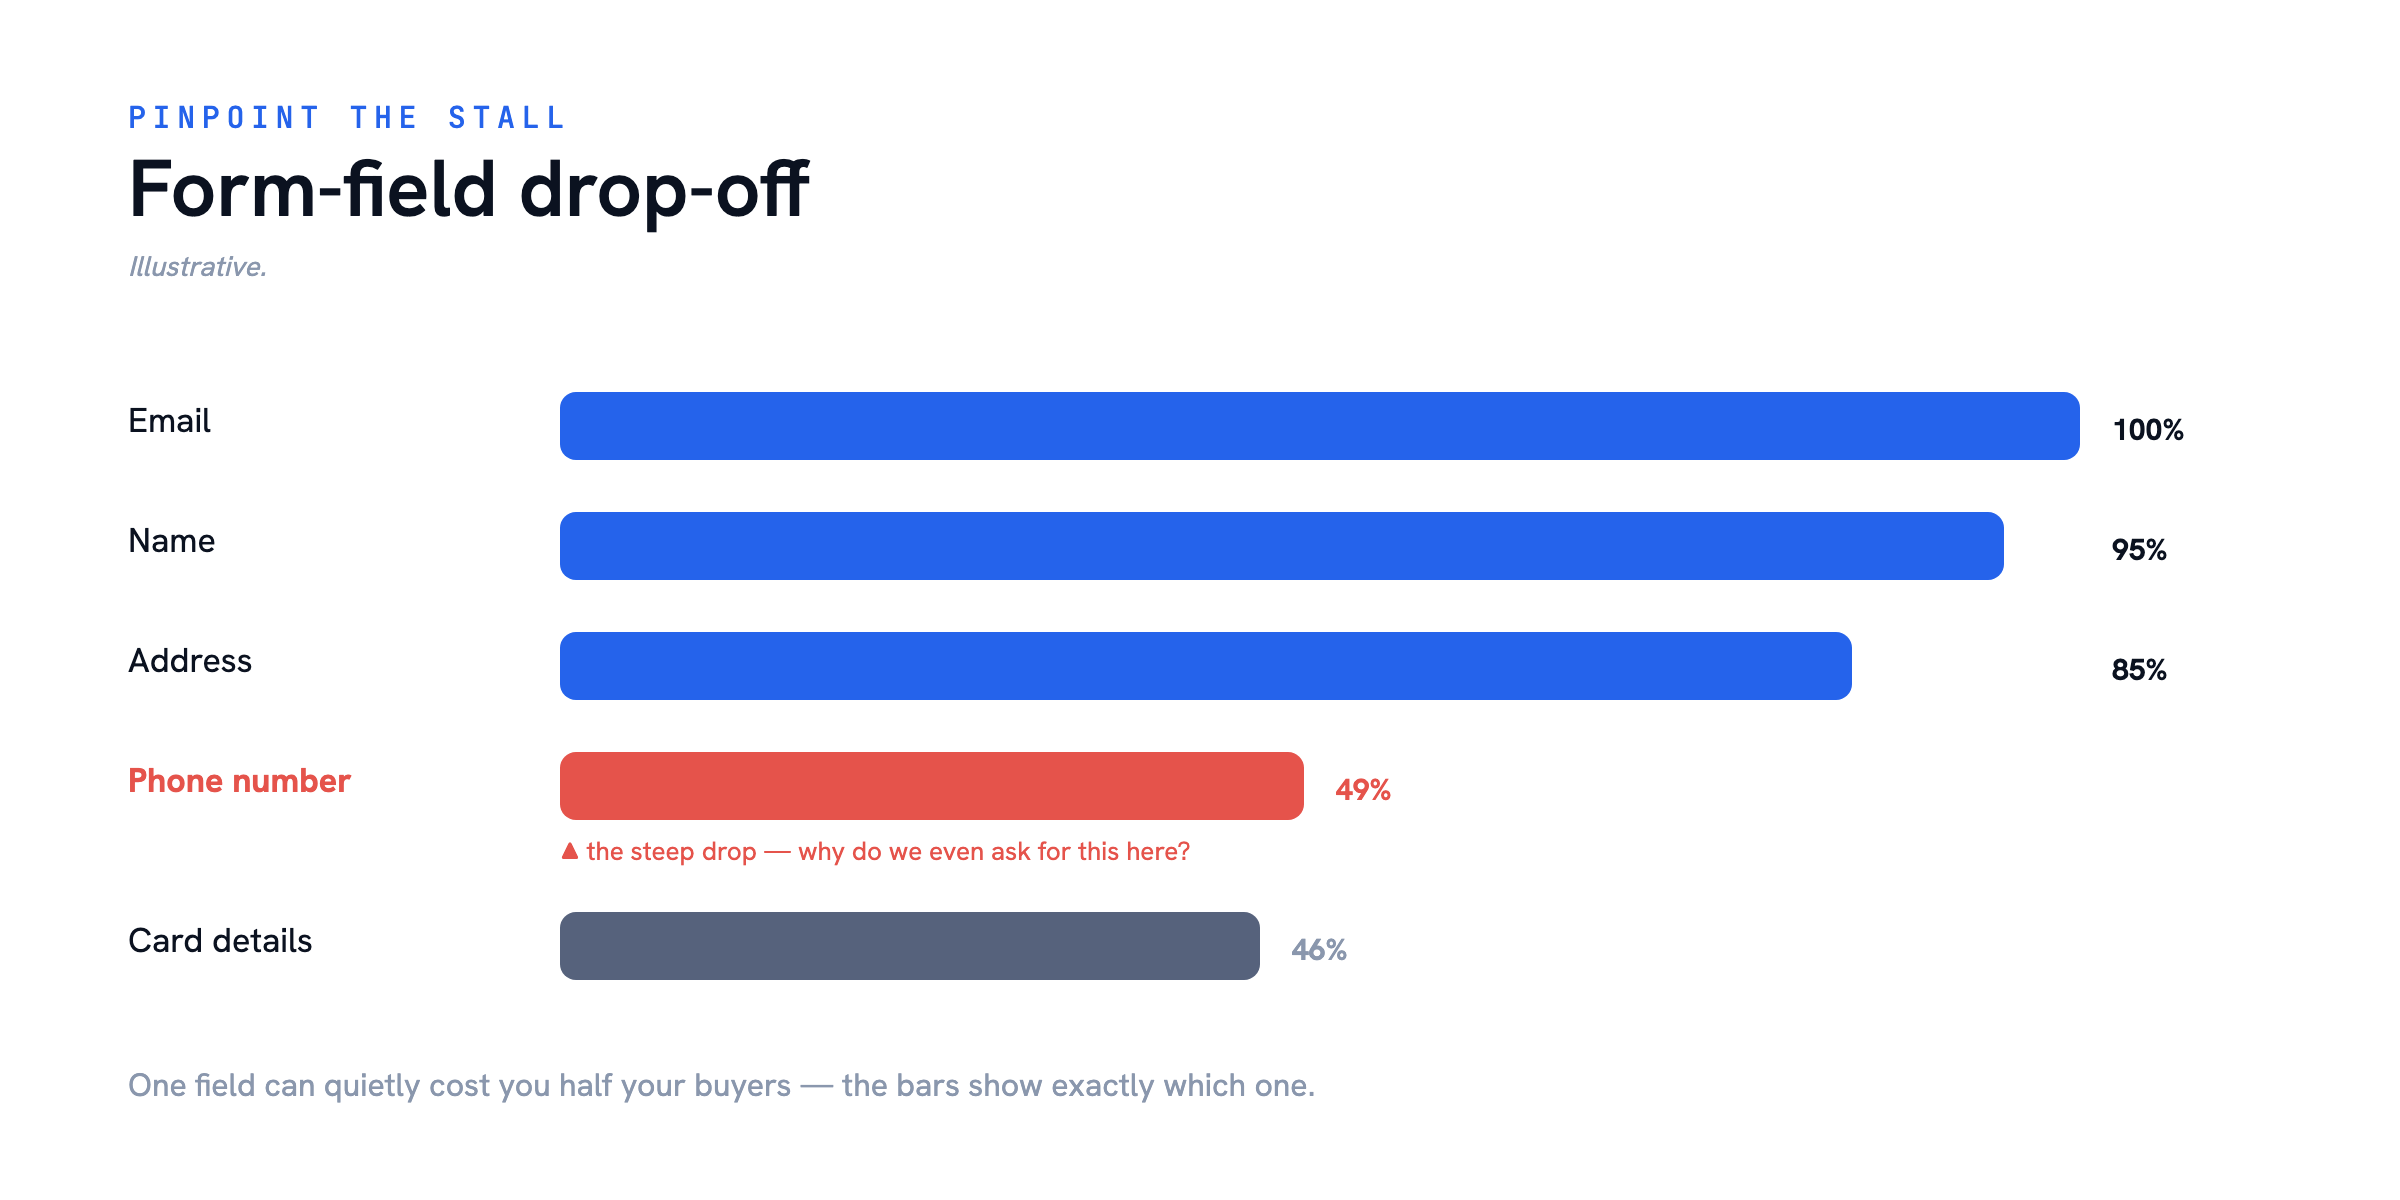
A heatmap shows you whether anyone is even reaching your call to action, or whether they all give up above it. A session recording lets you watch a visitor hesitate, scroll back up, hunt for something they can’t find, and leave. Form tracking shows you the exact field where people stall. Tools like Hotjar bundle these together, but the value is in the behavior they expose, not the brand of the tool — any capable heatmap-and-recording tool gives you the same signal.
What behaviors should you look for?
A few patterns are worth watching for, because each one points straight at a fixable problem:
- People aren’t clicking the call to action (or the links tied to your conversion goal). That’s
a sign the action isn’t clear, isn’t compelling, or isn’t where their attention is. It’s a prompt to rethink the copy, the placement, or the offer.
- People aren’t completing a form in a sensible order — jumping around, backtracking, abandoning
partway. That usually means the form is too long or asks for something people aren’t ready to give. The fix is often removing fields, not redesigning the page.
- People scroll right past the section you care about. If almost no one reaches it, the problem
may be that it’s too far down, not that the content is wrong.
Each of these is an observation, not yet a conclusion. The point isn’t to react to one recording — it’s to spot a pattern across enough of them that you can trust it.
How does this become a test?
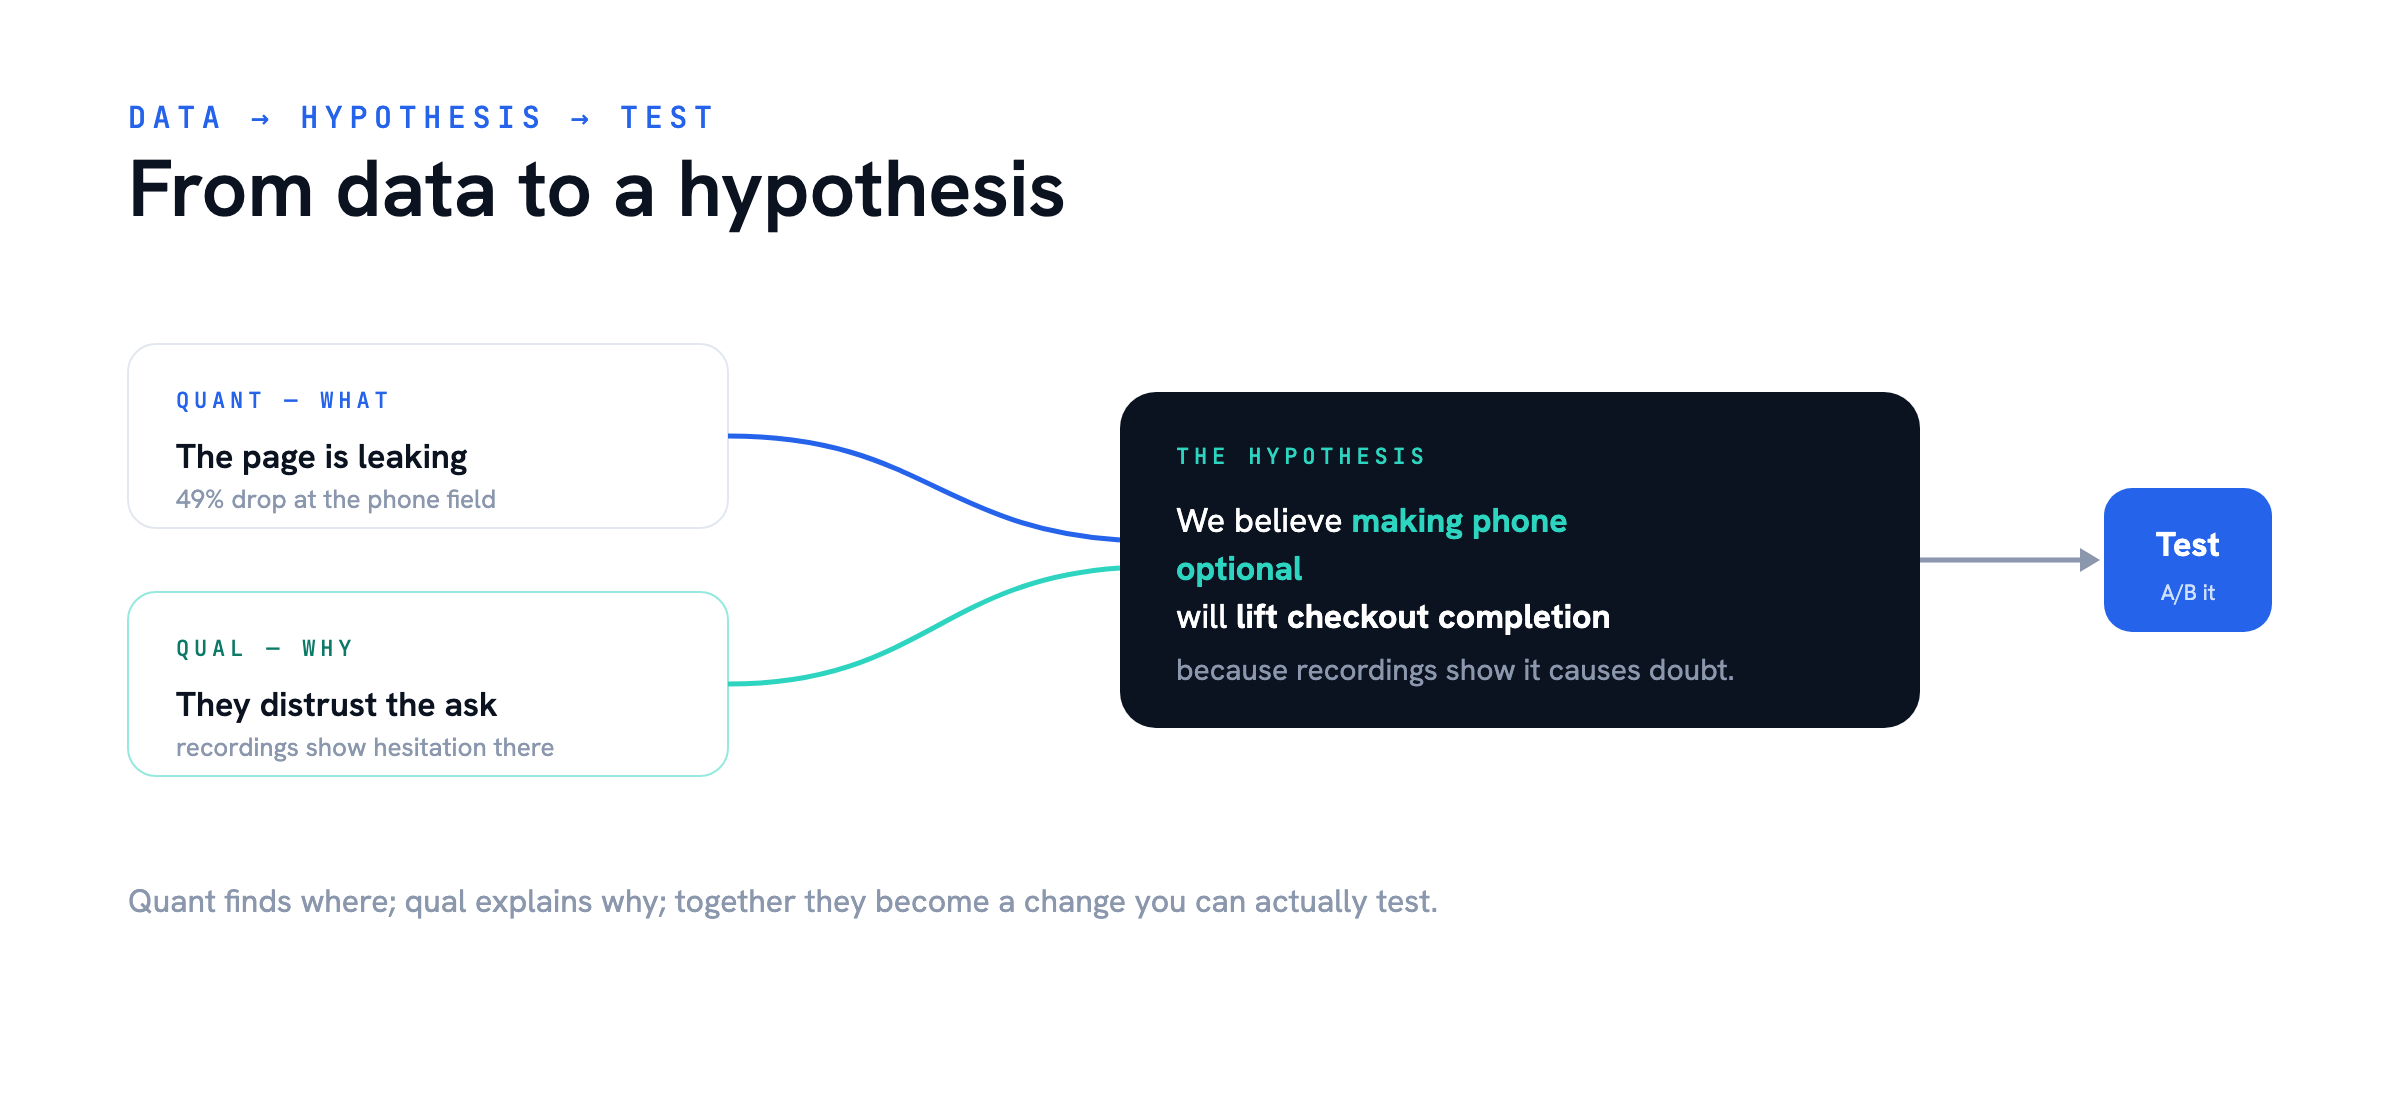
Once you’ve paired the where (this page leaks) with the what (people stall at this specific element), you have the raw material for a hypothesis: if I change this element, because it isn’t doing what I need it to, then conversions should improve, because — and you finish that sentence with the behavior you observed. That’s the difference between guessing and testing. A hypothesis grounded in real behavior is something you can run an experiment against and actually learn from, whichever way the result lands.
The next layer is the why — why people convert or don’t — but the where and the what are what get you to a testable idea in the first place.
If you’ve got the analytics and the recordings but aren’t sure how to turn them into a test worth running, that’s exactly what a conversion review is for. [Book a consultation](/contact/) and we’ll take a look.