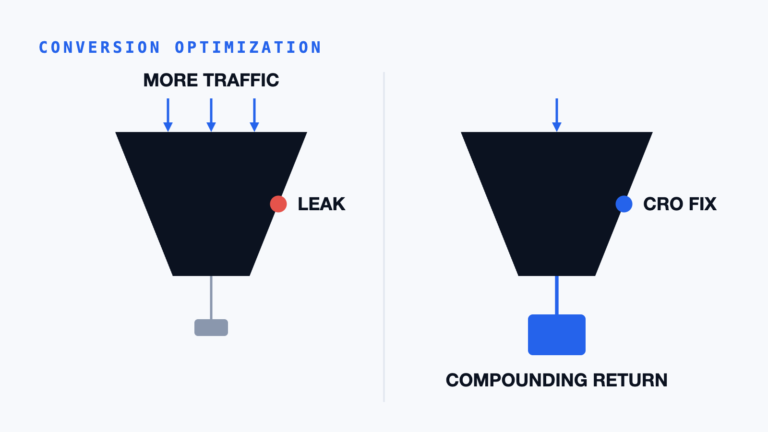
“The website isn’t converting” isn’t a location, it’s a symptom. A funnel is the sequence of steps a visitor takes toward becoming a customer, and the step with the biggest percentage drop is where the leak is. You can usually find it with the analytics tool you already have.
What is a funnel, in plain terms?
A funnel is just the ordered list of steps a visitor has to complete to convert, with a visitor count at each step. Picture it as a set of steps going down: everyone who lands, then everyone who views a key page, then everyone who starts the form or cart, then everyone who finishes. At each step, some visitors continue and some leave. The step with the biggest drop, in percentage terms, not raw numbers, is where the leak is.
This is different from looking at overall conversion rate. A single number tells you that something’s wrong; a funnel tells you where.
Where do you actually look?
The four steps below are the skeleton your funnel report needs before it can show a leak.
Your analytics tool almost certainly already has a funnel or goal-flow report; the work is setting it up to match your real steps, not finding a new tool. Google Analytics (and most alternatives) can build a funnel report from the pages or events that make up your conversion path. If one doesn’t already exist for your site, it usually takes defining three to five steps: the entry page, the key content or product page, the start of the conversion action (form, cart, booking), and the completion.
The setup work is worth doing once, properly, because a vague or mismatched funnel produces misleading numbers: a funnel that lumps unrelated pages together will point you at the wrong step.
How do you read the report once it exists?
Each drop location points to a different likely cause, summarized below.
Look at the percentage drop between each consecutive step, not the absolute numbers: the biggest percentage drop is your priority, regardless of how much traffic is involved. A step that loses a large share of visitors matters more than a step with a large raw number of visitors if its drop-off rate is proportionally smaller. It’s tempting to chase your highest-traffic page because the numbers look big; the funnel view corrects for that by showing you rate, not volume.
A few patterns are common enough to name:
- A steep drop right after the landing page usually means the page doesn’t confirm the visitor arrived in the right place, or doesn’t answer their immediate question.
- A drop between viewing a product/service page and starting the conversion action usually points to hesitation: not enough trust, clarity, or reason to act yet.
- A drop inside the form or checkout itself usually means friction in the mechanics: too many fields, unclear steps, or an unexpected requirement late in the process.
These three patterns line up closely with the most common CRO mistakes that quietly cost you customers, worth a read once you know which step is leaking, since it often names the exact cause.
What do you do once you’ve found the step?
Treat the leaking step as the answer to “where,” not “why”: the next move is finding out what’s actually happening on that specific step. Once you know which step loses the most people proportionally, that’s where diagnostic tools, heatmaps, session recordings, form-interaction tracking, earn their keep, because now you’re pointing them at the right page instead of guessing. How to find what to improve on your website covers that next layer once you’ve narrowed down to a specific page. Skipping straight to fixes without this step is how businesses end up redesigning a page that was never the actual problem.
What to do next
- Check whether your analytics tool already has a funnel report set up. If not, defining three to five real steps is usually a short setup task, not a project.
- Once it exists, look for the single biggest percentage drop, not the page with the most traffic, and start there.
- If you’re not sure your funnel is even measuring the right steps, that’s worth a second pair of eyes before you draw conclusions from it.
Full methodology in the plain-language CRO guide, or start here for a free assessment: we’ll help you find the leak, not just admire the numbers.
Alex’s Perspective
Reviewing thousands of conversion audits, the most common mistake isn’t a bad hypothesis; it’s chasing the highest-traffic page instead of the page with the steepest percentage drop. Volume feels more urgent than rate, but rate is where the leak actually lives. As a hypothetical: a page losing most of a small trickle of visitors usually matters more than a high-traffic page losing a modest share, even though the high-traffic page looks like the bigger problem on a dashboard. It’s an easy mistake to make once, and an expensive one to keep making across an entire optimization roadmap.
Where this fits
This is the Discover stage in its purest form: finding exactly where the funnel breaks down before anything gets prioritized, tested, or fixed. Every later stage of the Experience Optimization Framework inherits whatever this step gets right or wrong, since a prioritized roadmap built on the wrong leak point wastes the effort that follows it, no matter how well-executed.
Alex Harris leads AlexDesigns’ diagnostic work; funnel reads like this one are usually the first deliverable on a new CRO engagement, before a single test gets built. Any pattern named above reflects what actually shows up across real funnels; the traffic/rate example is labeled illustrative.